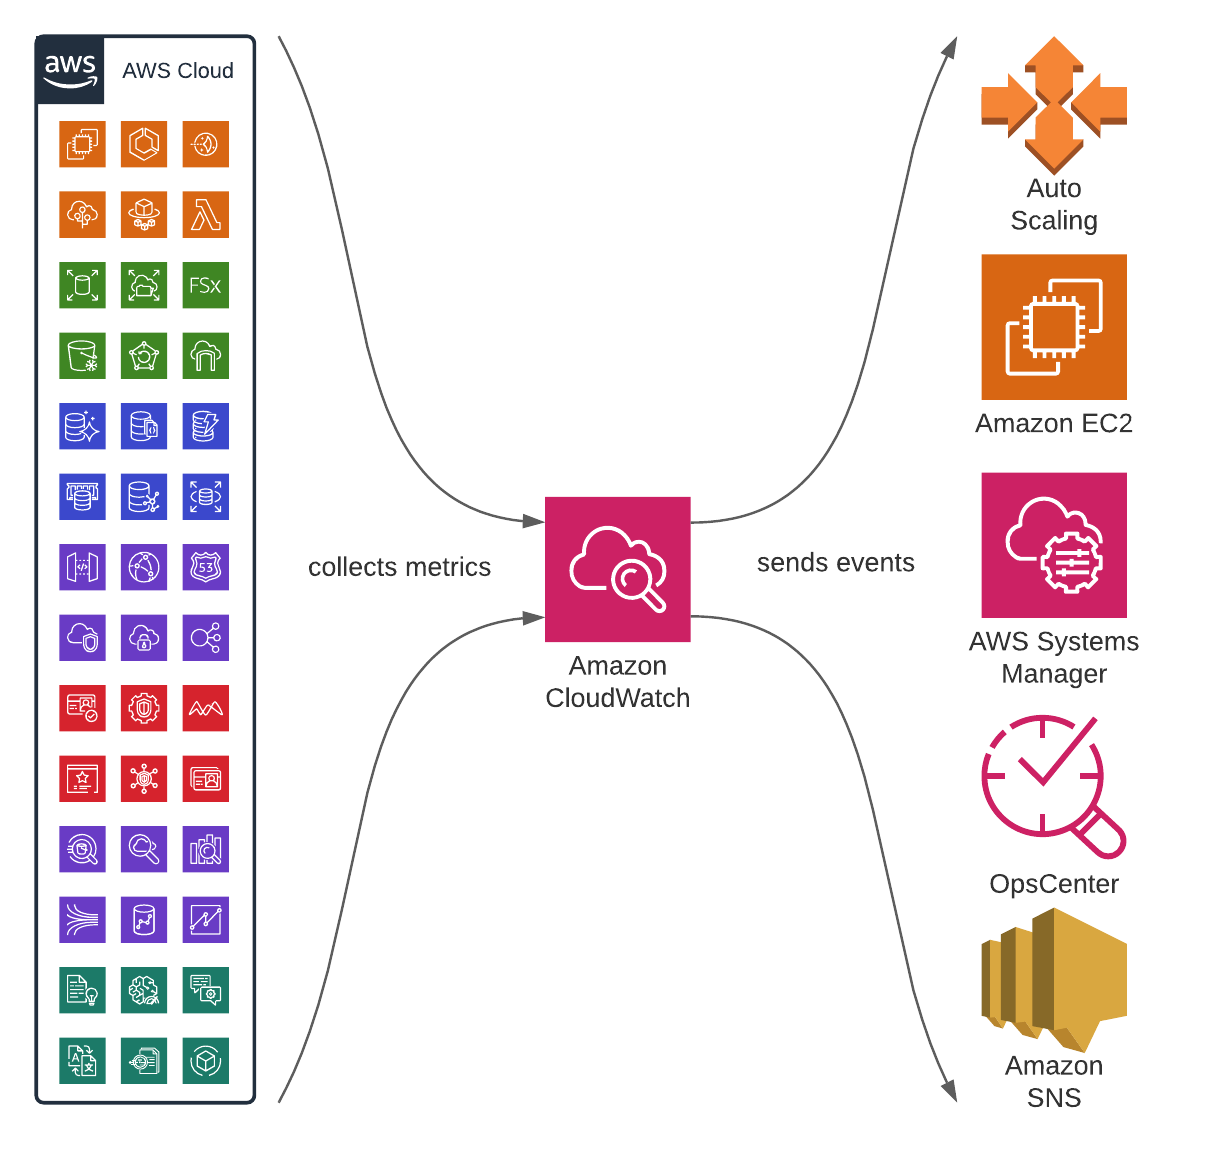
Amazon CloudWatch is a service targeted toward DevOps, developers, SREs, product owners, and IT managers. It essentially provides observability and monitoring capabilities by collecting thousands of metrics from other AWS services; assembling them into actionable insights to monitor system-wide changes and resources.
Its potential exceeds monitorability as it can be used to trigger alarms based on resource metrics, visualize logs, trigger actions, and prevent anomalies. Its triggers can be configured to
- Send an SNS notification
- Create an OpsItems or Systems Manager Incident
- Perform operations on EC2 instances
- Perform EC2 AutoScaling actions
Cross-Account Alarms
CloudWatch alarms enable the monitoring of entire organizations by creating composite alarms. This provides an extra layer of monitoring into cross-accounts, thus allowing the monitoring of spending on enterprise levels.
This option massively facilitates the resources required to avoid degradation or failures over services spanning multiple accounts. Since the actions also include the auto-scaling operations, organizational preservation could be deeply automated with the ability to create cross-account cross-region dashboards spanning multiple CloudWatch metrics.
Setting Up a CloudWatch Alarm
Creating a CloudWatch Alarm is a precise process that requires maintaining a set of rules to ensure that the proper measures are taken when the right conditions are met. The process includes 10 individual steps and below is a step-by-step guide with the appropriate precautions:
Ensure the right permissions
Ensure you have the proper CloudWatch permissions to create and manage
Alarms. In general, Access control and writing permission policies are attached to IAM identities, AWS provides a table with API operations with the respectively required permissions.
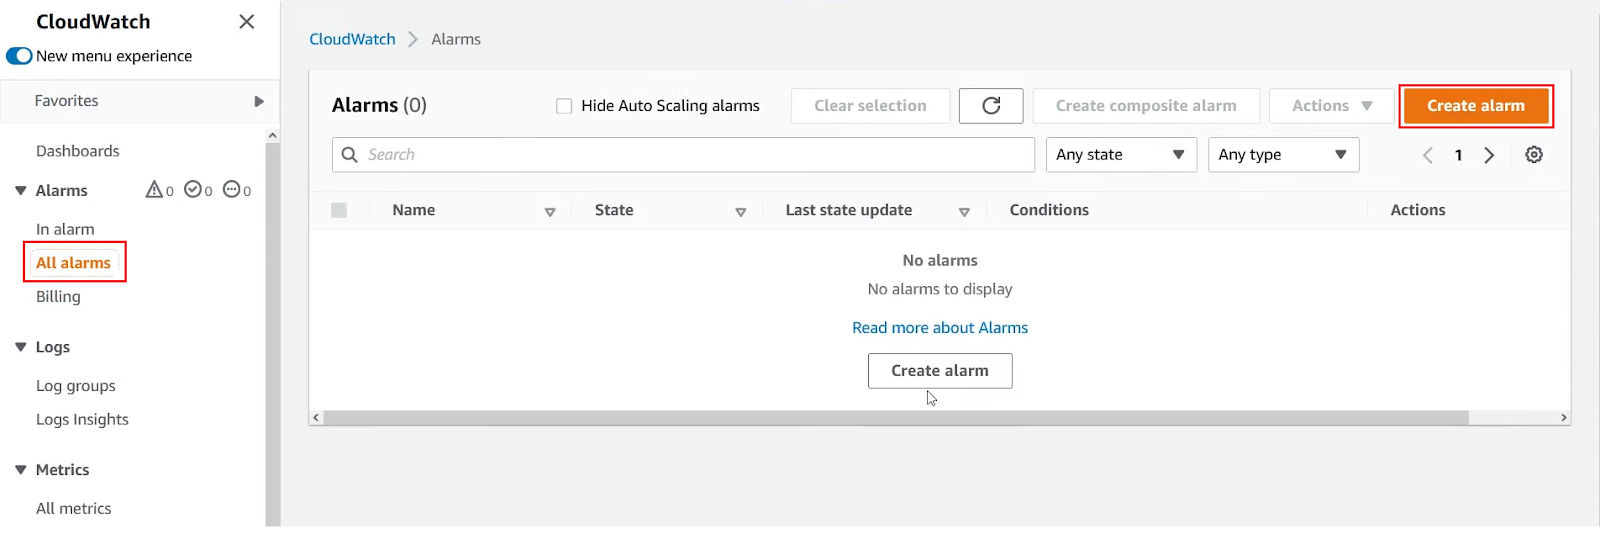
Initiate the process
To start the process, you will have to first open the CloudWatch Console and use the navigation page to expand “Alarms”, then press on “All Alarms” >“Create Alarm”:
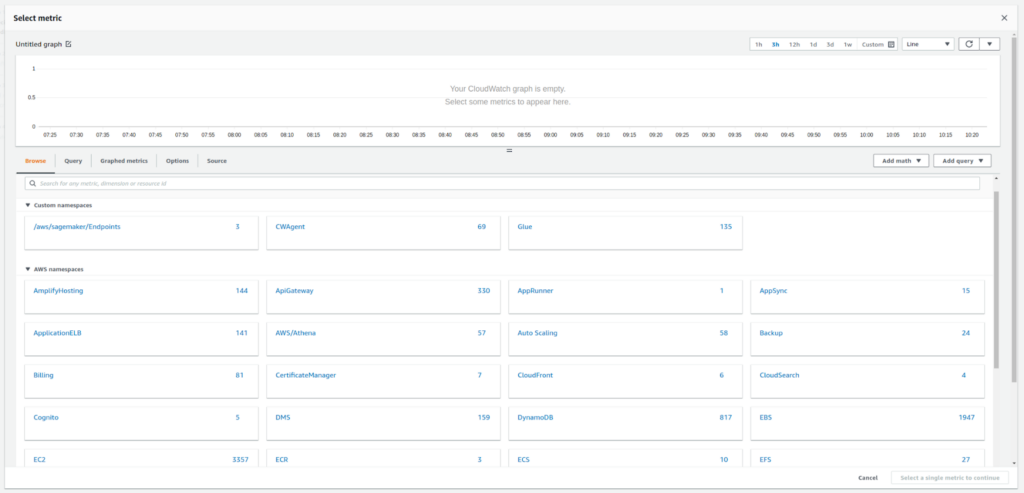
Condition phase
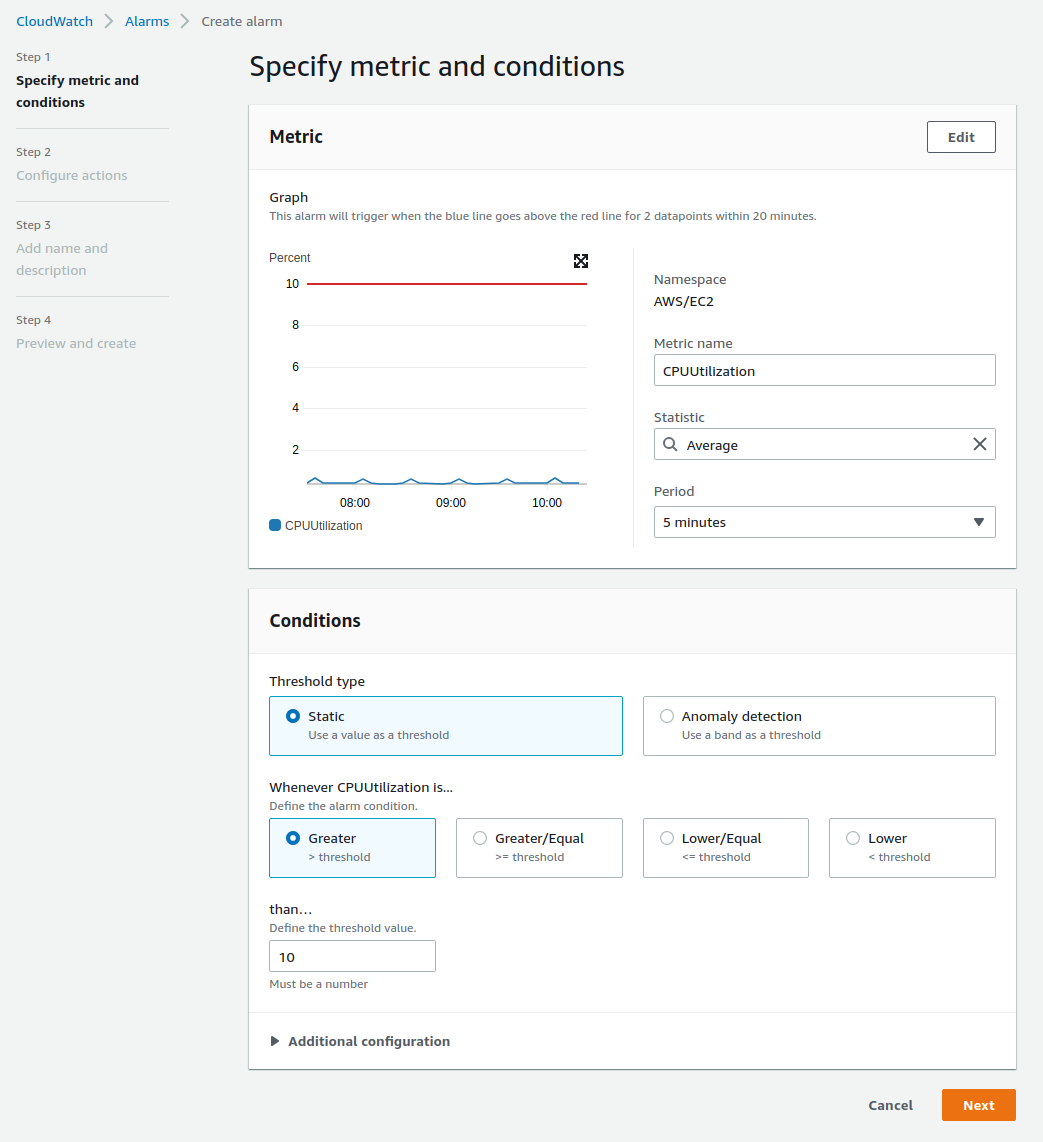
The first step in creating an Alarm is specifying the metric and conditions. When pressing the “Select Metric” button on the user interface below, the user will have to specify a single CloudWatch metric or add an algebraic expression built around that value metric. Usually, the action that will come next would be associated with a threshold value assigned to a specific metric over a number of time periods.

Choosing the metric
Select the metric to monitor with the alarm. The metric options include the free provided insights into resources like Amazon EC2 instances, Amazon EBS volumes, and Amazon RDS DB instances. Detailed monitoring is also supported if enabled, in addition to personal application metrics as those can be added for search, graphing, and alarms.
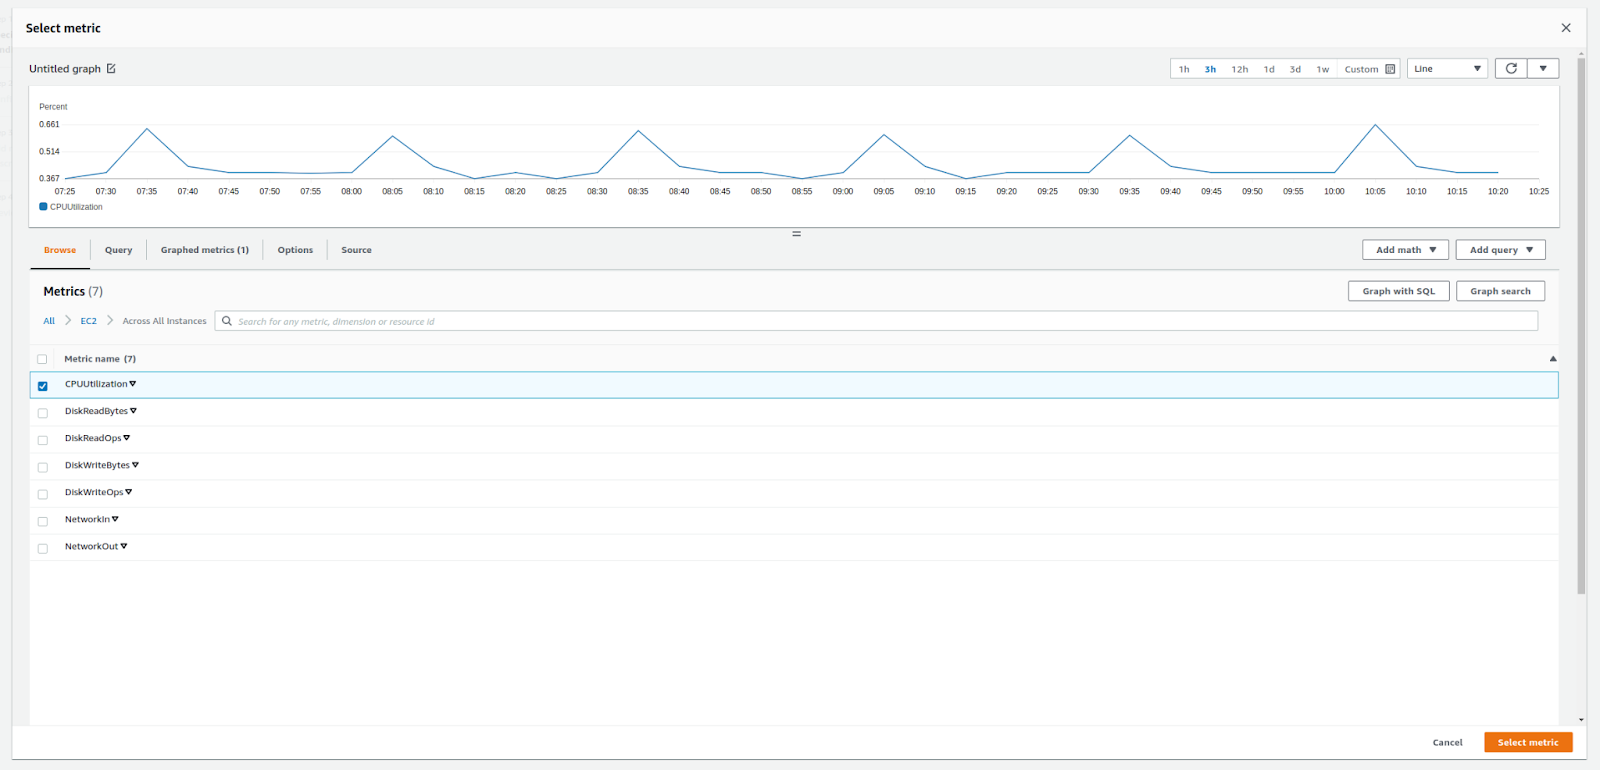
In the example below, we are monitoring CPU utilization across all EC2 instances:
Statistics and time periods
After choosing the proper metric, you can now choose the statistics which represent aggregations over a time frame pre-determined by the user. In this step, it’s important to wisely pick the Period of time as the values collected will span the specified timeframe. CloudWatch supports a list of statistics documented by AWS here.
As for the conditional options, the user will have the option to define a value or band as a threshold with a specific mathematical condition (greater, lower, lower\equal, greater\equal).
In the example below, we are setting the alarm threshold to 10% of the average CPU utilization over 5 minutes:
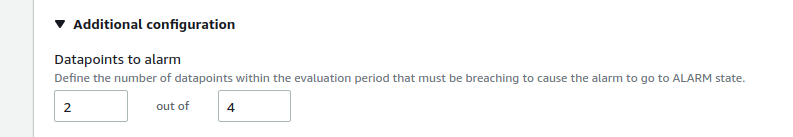
Additional Configurations
In the “Additional Configuration” section, the user can define how many data points need to breach the threshold in order for the alarm to be triggered:
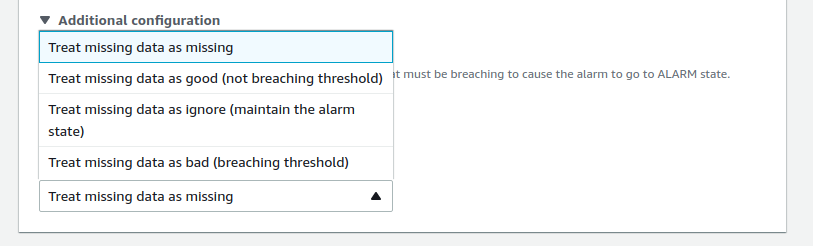
Missing data treatment
In the “Additional Configuration” section, define how Cloudwatch should treat missing data. In the example below, we are “treating missing data as missing”:
Configure actions
After deliberately defining the conditions, next comes choosing the actions that will be triggered given said conditions. The user will have multiple actionable options such as: sending a notification to an Amazon SNS topic, performing an Amazon EC2 action or an Amazon EC2 Auto Scaling action, or creating an OpsItem or incident in Systems Manager.
In the example below, we are choosing an SNS notification, with an existing SNS topic:
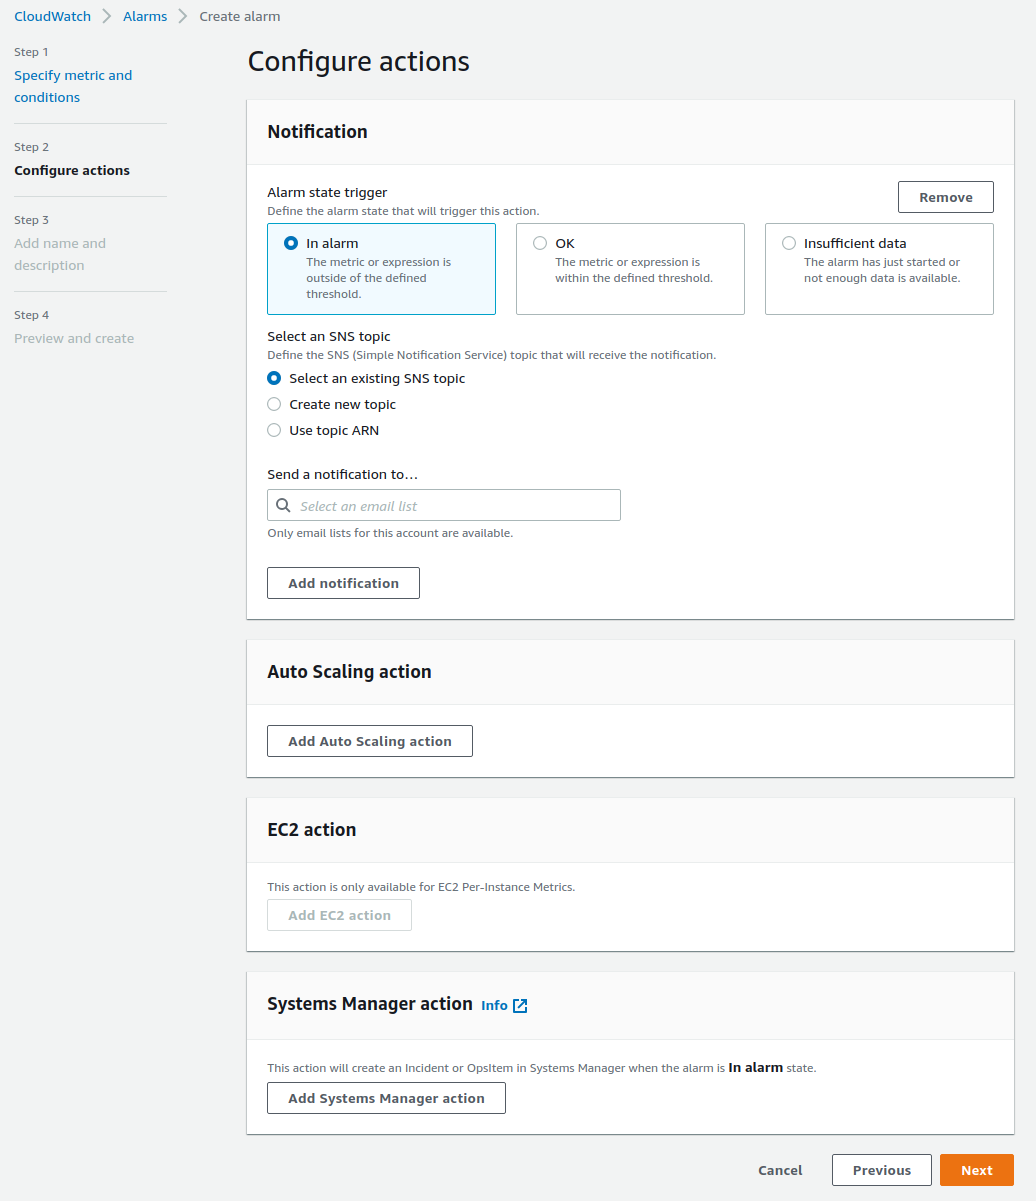
Note that when creating an Amazon SNS with CloudWatch the publication of alarm notifications will cover both the standard topic or FIFO topic.
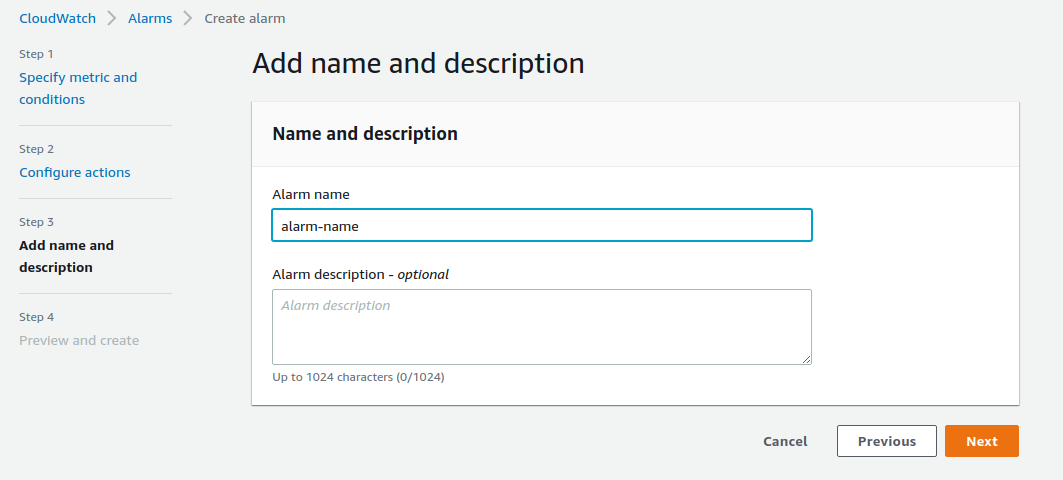
Name and description
Next, enter a name for the new alarm. Users can briefly describe the alarm – this is optional, but is recommended if you create many similar alarms:
Summary
Finally, the user can review the alarm preview which summarizes the alarm metric, conditions, and action:
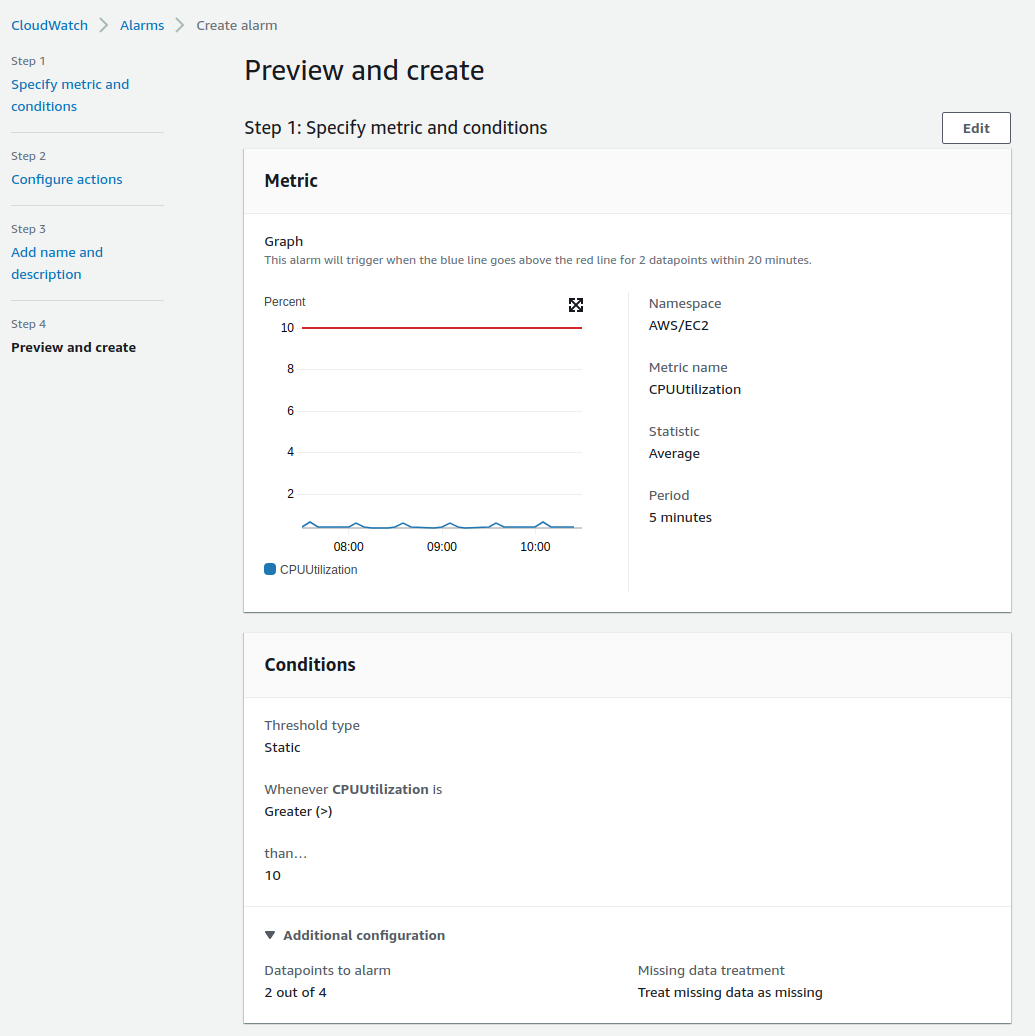
After thoroughly assessing the summary; if the alarm has been configured correctly, the user simply clicks “Create Alarm”.
Pricing of CloudWatch alarms
Finally, we cannot forget the pricing of CloudWatch alarms. CloudWatch alarms are part of the features offered by CloudWatch, thus they share the bill. Starting with AWS CloudWatch is usually free as most of the services (EC2, S3, Kinesis, etc..) share the metrics automatically with CloudWatch for free. This process is part of the AWS free tier offering for CloudWatch and it includes 10 Alarm metrics with standard resolution.
If a user plans on exceeding the assigned free tier limit, charging will be based on what is used at the end of each month (bill per usage). The pricing will then heavily depend on the resolution and type of Alarm used. Below is an example of the price distribution in the US-East region, comparing Standard resolution, High resolution, and Composite Alarms:
| Standard Resolution (60 sec) | $0.10 per alarm metric |
| High Resolution (10 sec) | $0.30 per alarm metric |
| Composite | $0.50 per alarm |